“Brain Charts for People Living with Multiple Sclerosis.”
Anisha Keshavan, et al. – Octave Bioscience.
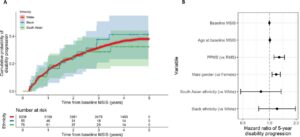
Background: Interpreting brain volume changes in patients with MS requires models that account for variation related to factors such as age, sex, and the scanner used. Additionally, the reference sample should be other patients and not healthy controls, since these measurements are typically made once disease status is known and patients tend to exhibit greater grey matter decline than healthy controls.
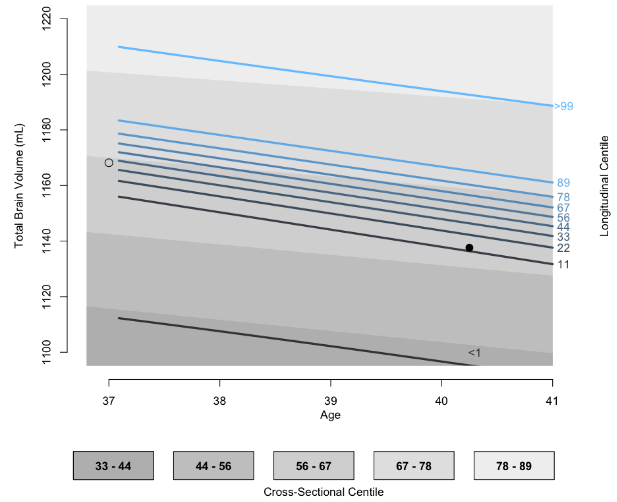
This Study: Using longitudinal data collected at 5 sites with 13 scanner models, Keshavan and colleagues created “brain charts” along the lines of pediatric growth charts. These charts allow for determining how a given patient’s total brain and ventricular volume compares to other patients of the same age and sex after adjusting for confounding factors like the scanner employed. Longitudinal brain charts provided additional insight by capturing significant volume losses between individual scans, even when the volumes on those scans are in normal ranges when viewed cross-sectionally.
Bottom Line: Brain charts enable more precise tracking of neurodegeneration for patients, providing greater clarity on how they compare to other patients with MS.